Daily (DCL)
declining
Into cycle4 days
Translation
Even
Last low2026-09-30
Latest barClosed
CycleFAILED
Chart & cycle-analysis proxy: iShares Silver Trust (SLV) · $55.45 per ETF share · as of 2026-10-06
SLV is an ETF proxy. Price is USD per share, not spot metal per ounce. Counts are automated swing-based estimates; yearly structure is not confirmation of an eight-year cycle.
A close below a previous weekly cycle low keeps the bearish case in control. A bounce alone is not evidence that the larger decline is over.
Open-cycle translation can change before the next confirmed low.
A confirmed weekly low followed by a sustained advance and a right-translated completed cycle would strengthen the bullish case.
A left-translated cycle spends fewer bars advancing than declining. Open cycles are provisional.
| Weekly low → low | Rally | Decline | Translation |
|---|---|---|---|
| 2026-07-13 → 2026-08-03 | 1w | 2w | Left |
| 2026-08-03 → 2026-08-17 | 2w | 0w | Right |
| 2026-08-17 → 2026-09-14 | 1w | 3w | Left |
These are consecutive confirmed swing cycles, not analyst-selected 18–30-week intermediate cycles. Short swings can be nested inside a larger weekly cycle. A phase call is an interpretation, not a probability. Read the framework.
Silver is in the declining phase of the weekly swing cycle — 3 weeks into a cycle that has historically run a median of about 5 weeks. The last ICL printed 2026-09-14, and the cycle is left-translated so far — and has failed (closed below the prior cycle low). On the separate yearly-bar view, the automated read is advancing, 6 years in, right-translated. This yearly-bar count is separate from the eight-year thesis above.
Automatically derived from confirmed swing lows. Published analysis, where available, is dated separately.
| Low → Low | Len | Transl. |
|---|---|---|
| 2018-01 → 2020-01 | 2y0m | Right |
| 2015-01 → 2018-01 | 3y0m | Left |
| 2020-01 → now | open | Right |
Reused from paragraph.com/@swingtrading · 2022 (weekly-cycle context as of mid-2022). The live status header and charts above reflect current data; this is the long-form cycle reasoning, not a dated price call.
There have been 4 weekly cycles since silver had it's blow off top in August 2020. Everyone is waiting for the weekly cycle that will retest $30 or maybe even more. As a starting point, if you're unfamiliar with cycles analysis please review the cycle 101 blog post or video.
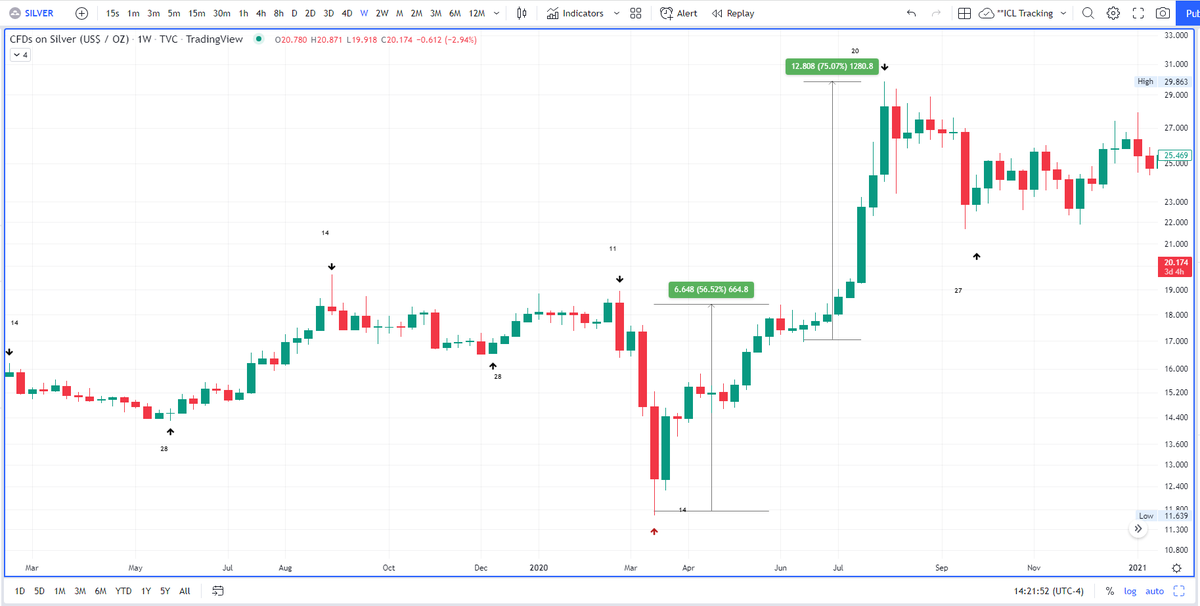
In the chart below you can see all the weekly cycles going back to late 2019.
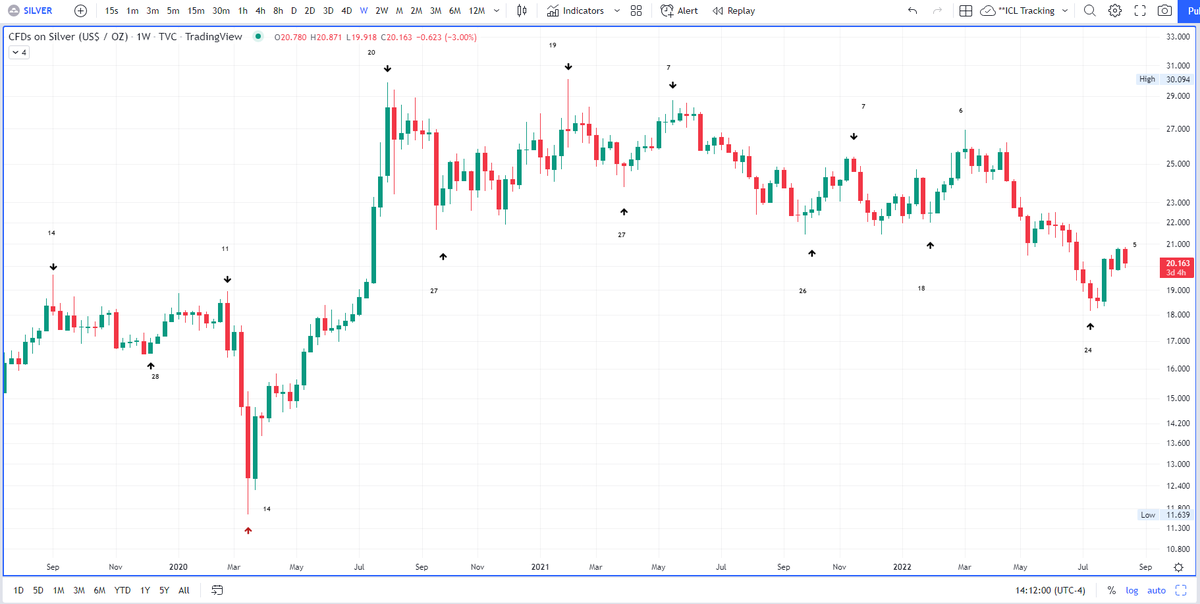
During the COVID crash silver made a weekly swing high on week 11 of its weekly cycle and then declined 39% over the course of four weeks to a low of $11.64. Since weekly cycles for silver are usually 25-28 weeks long, that was an unusually short weekly cycle at 14 weeks and this is an important concept.
Sometimes, the decline is so extreme that the cycle ends sooner than it usually does. You can think of it as running out of sellers for the sake of simplicity. This is something to look out for in the future when we see a waterfall decline unfold. It's at these times we need to be on guard for a shorter cycle especially as a possible catalyst emerges.
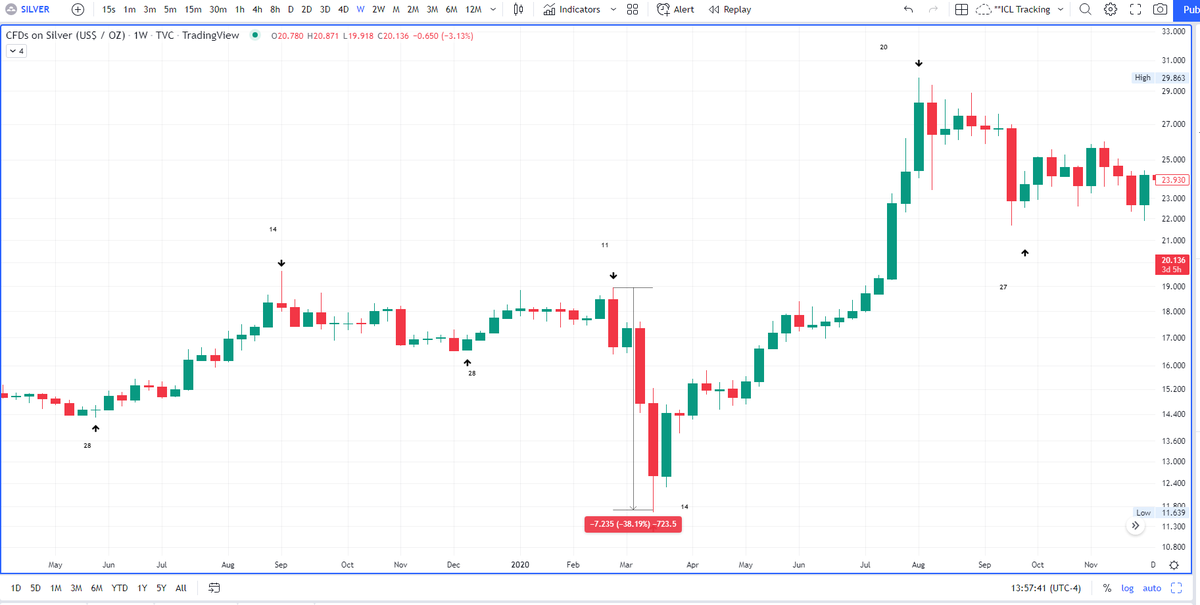
The weekly cycle coming out of the COVID low is the model for a bullish weekly cycle for silver. It's literally the most bullish weekly cycle silver has had in over 10 years both in terms of the percentage increase for the advancing phase and the length of time. The ICH came on week 20 and the low was week 27 so very right translated and more importantly we had a 155% rally in that time frame.
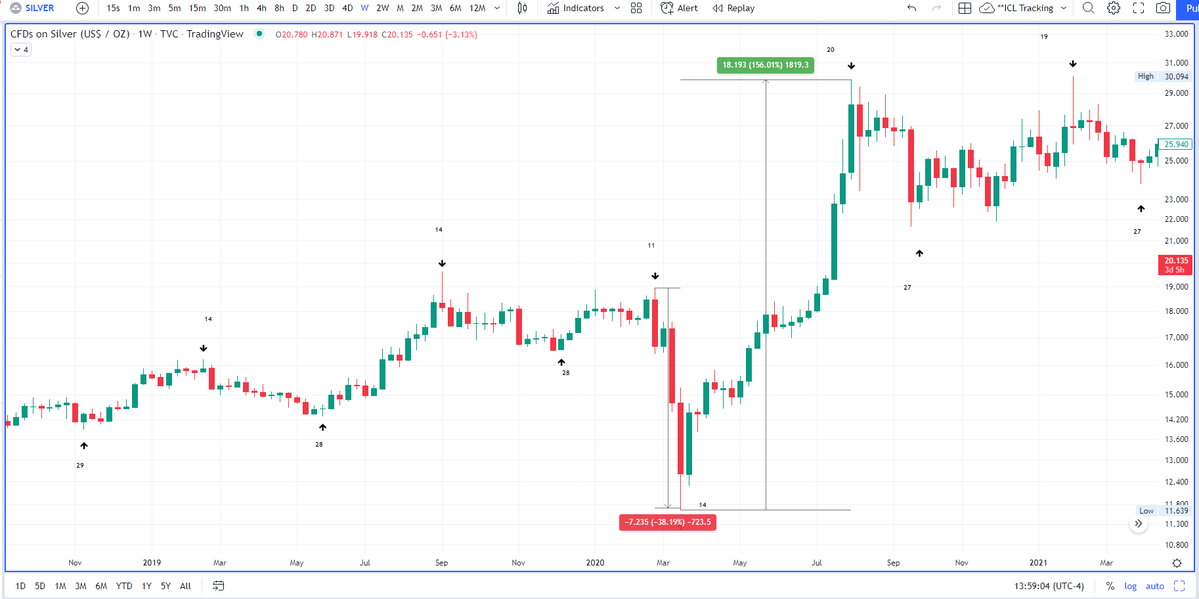
The first weekly cycle after that parabolic run was also right translated with the high occurring on week 19 in February 2021. This was during the #silversqueeze craze where we had a massive gap up on Monday but then proceeded to give it all back throughout the course of that day.
Indeed, you would have had to take profits that same Monday. The enormous upper wick on that weekly candle in the chart below really tells the tale. Whenever you see a huge upper wick, it's an indication that there was a bearish reversal on a lower time frame. In this case, the gap up on Monday did end green but then there was a massive rejection on Tuesday turning the Monday candle into a daily swing high which eventually became the ICH.
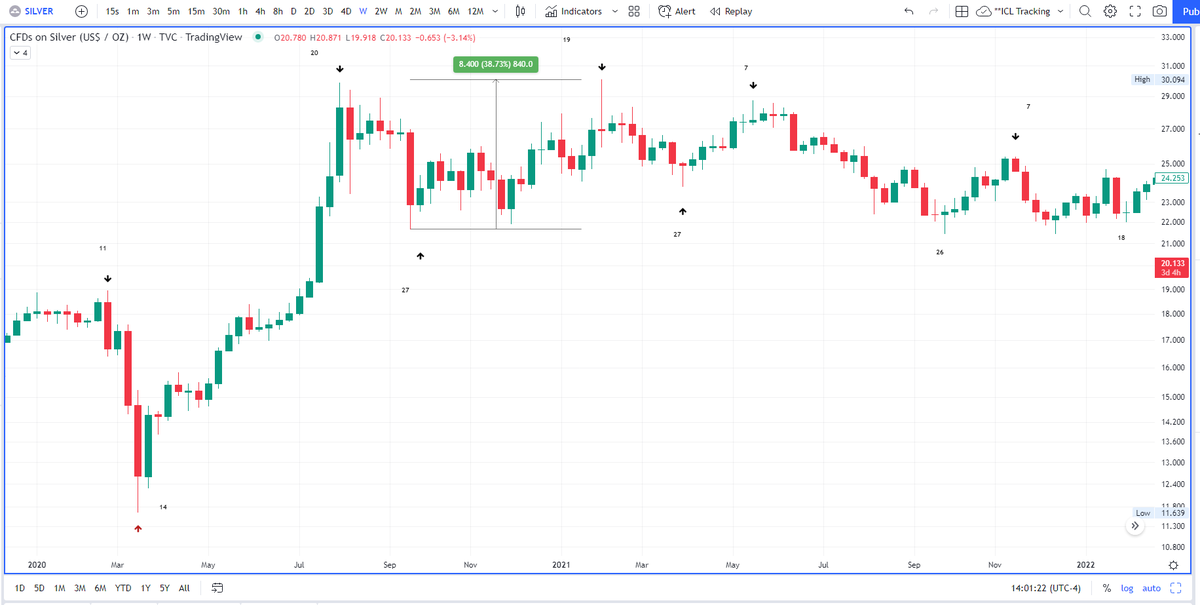
What followed were 3 very left translated weekly cycles starting in April 2021. As you can see in the chart those 3 cycles ended on week 7, 7, and 6 respectively.
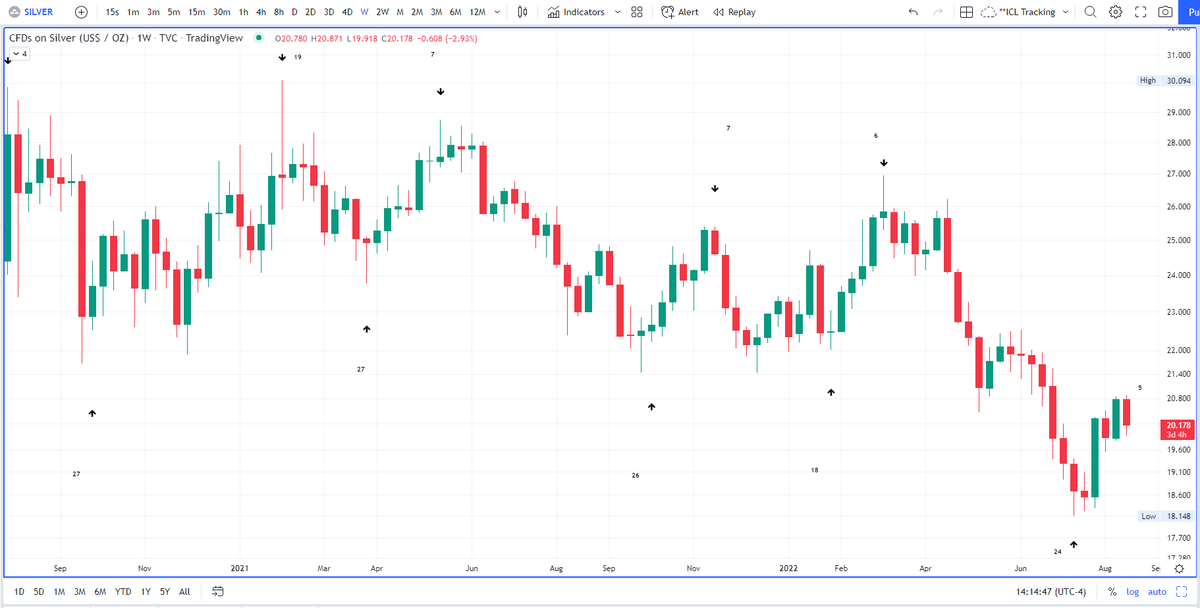
This most recent cycle that just ended in July was a real doozy with a 32% decline from peak (ICH) to trough (ICL) and now we find ourselves in a new weekly cycle on week 5 of a new weekly cycle
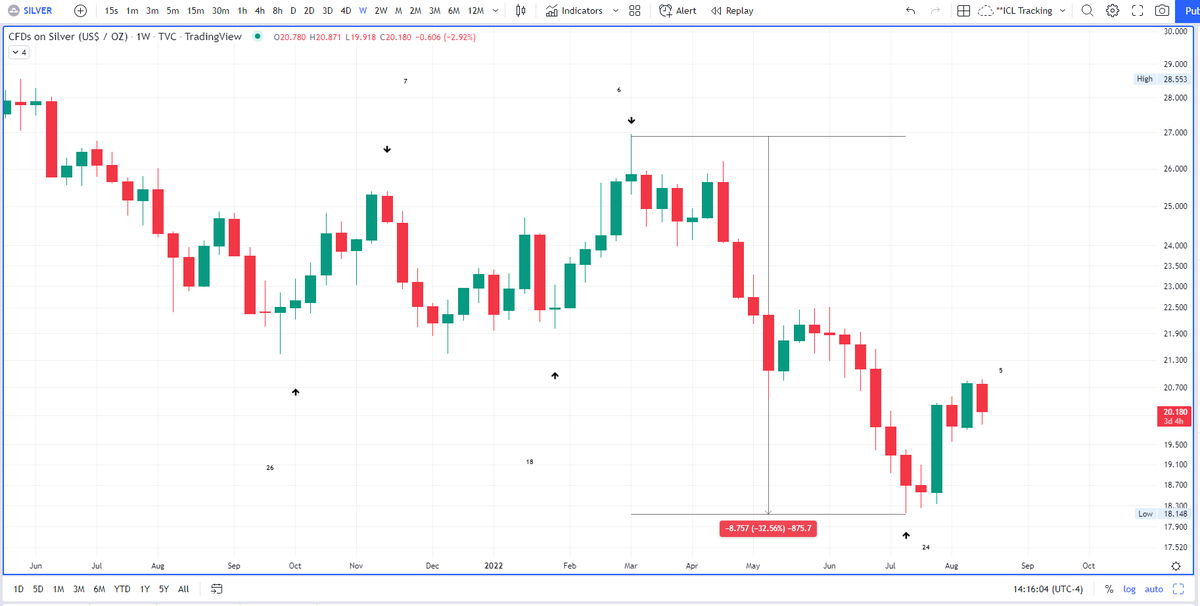
After all these bearish weekly cycles we are bound to get another bullish one. Since we know cycles are nested within each other, you can think of all these bearish weekly cycles as the declining phase of a larger/longer term cycle.
Imagine a longer term cycle that consisted of 10 weekly cycle for instance. If this hypothetical long term cycle were very left translated we could see 2-3 bullish weekly cycles followed by 7-8 bearish weekly cycles. In essence, the first few cycle which are bullish would be the advancing phase of the longer term cycle and the series 7-8 bearish weekly cycles could be the declining phase.
The catch is we don't know how many bearish weekly cycles we have to get through before the next long term cycle begins again and we get at least 1-2 bullish weekly cycles. This is an important concept to understand as it will allow you to be patient and wait for the optimal entry. This doesn't mean you have to time it down to the day. Since we're talking about long term trends here there will be a margin of error and you're really just trying to catch the middle 80% of the move which should be plenty of upside when it finally comes.
This current weekly cycle will not be the one to take silver back to all time highs but at some point we will get that move and understanding how to use cycles will allow you to take a data driven approach that's not overly swayed by emotions. You don't want to get FOMO and buy at the wrong time or sell close to the bottom if you find yourself trapped. You never have to worry about "missing the train". Nothing goes up in a straight line so you will have a chance to get in.
No need for FOMO. You will NOT miss the train. Every uptrend has pullbacks you can use to enter.
You want to put the odds in your favor and buy only after we have sufficient evidence that a major cycle low is in. At this point I'm not expecting that through the end of 2022 since this current weekly cycle is left translated. Patience is key here. Focus on other things and when silver is ready to break out, you will have plenty of time to get on the train!